
Based in Chicago, IL
About
Hi, I'm Tatyana
I am a data analyst with expertise in automation, Python, SQL, Tableau, large language models, generative AI, and analytics tools including PostHog and Google Analytics. I am motivated by the potential of data to drive strategic decisions and create positive change, and I'm dedicated to turning complex datasets into actionable insights that solve product, marketing, and operational challenges. I am a Colorwave Alum and a Tech Fellow Alum through Chicago Innovation's The Ladder Program. In my free time, I am an organizer for a 1000+ member meetup called People of Color Code.
Resume
Education & Experience
Data Analyst
Warmer
Full-time
Technical Associate
The Chicago Public Education Fund
Full-time
Technical Fellow
The Chicago Public Education Fund
Full-time
Software Developer Consultant
Reach Pathways
Contract
Software Development and Data Science Associate Instructor
Coding Temple
Full-time
Tier I Tech Support
The Vitality Group
Full-time
Bachelor of Psychology
Middlebury College
my skills
My Skills

AWS S3

CSS

Django

Flask

Javascript

Jupyter Notebook
Google Analytics 4

Google Suite

Microsoft 365 Suite

Numpy

Pandas

PostgreSQL

PostHog

Postman

Python

Qualtrics

React

Rest APIs

Salesforce

Tableau
portfolio
Featured Websites
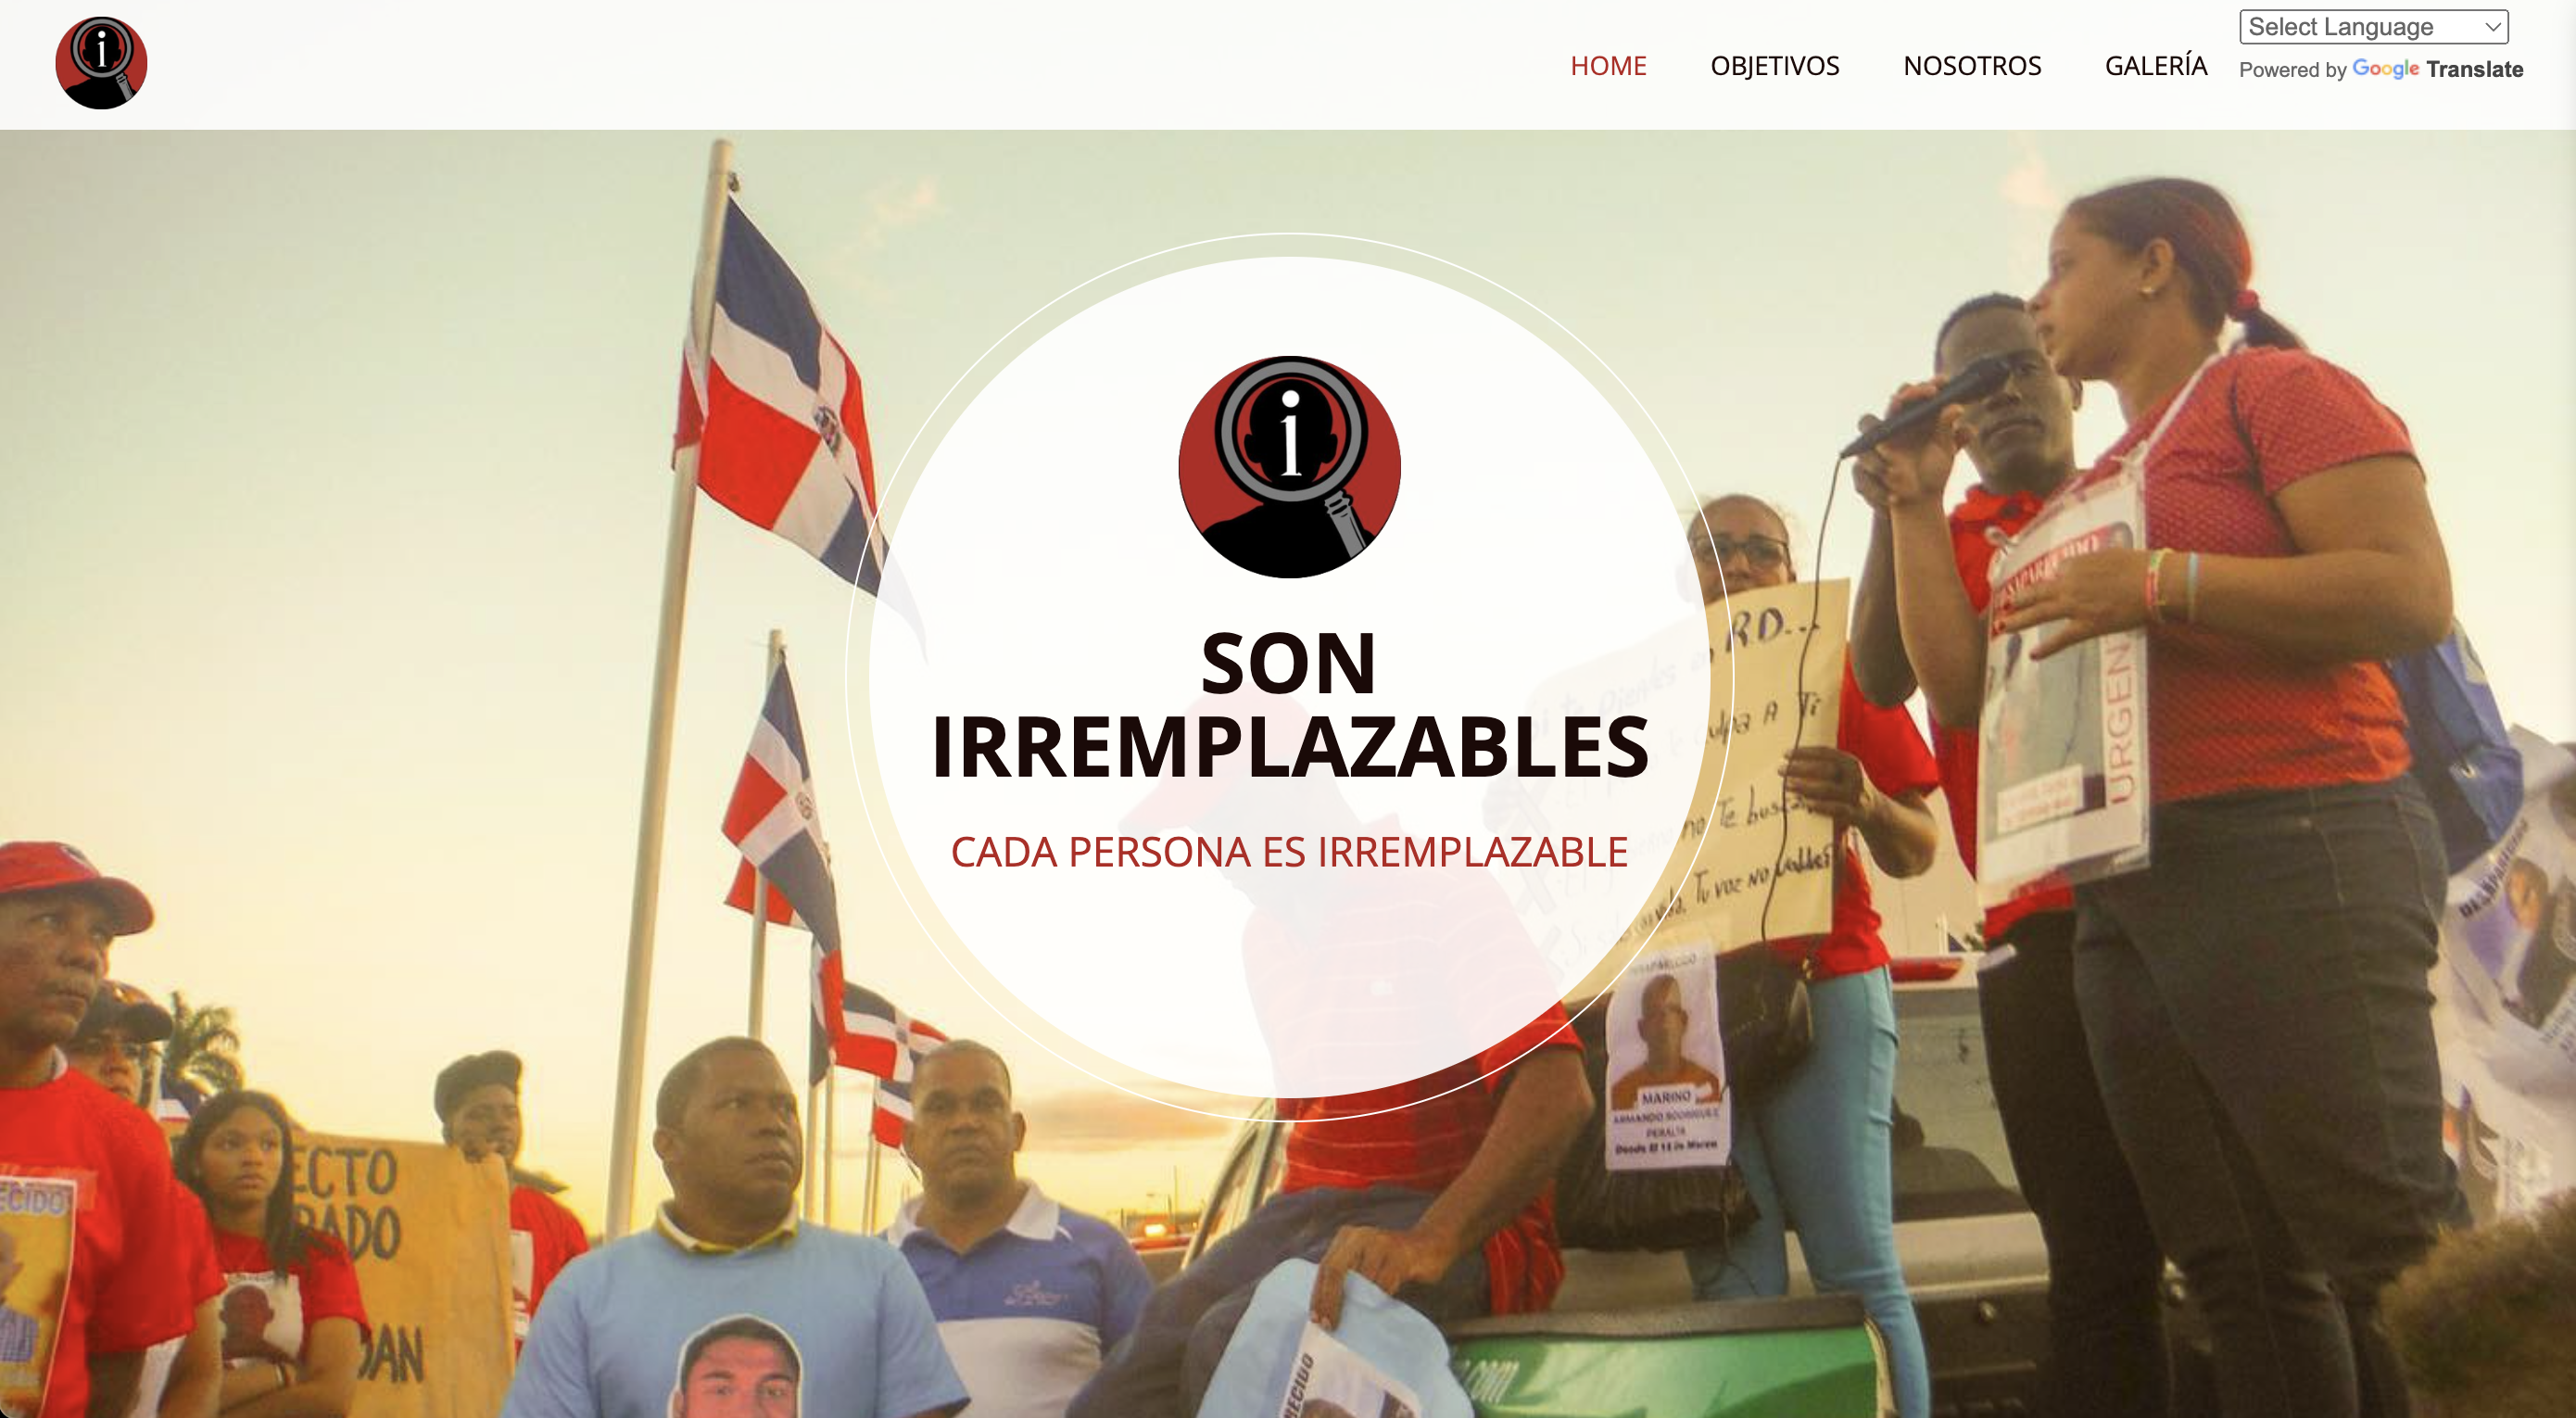
Son Irremplazables ("They are Irreplaceable")
I built the website for Son Irremplazables, a grassroots initiative raising awareness about missing individuals in the Dominican Republic. The site highlights disappearances and their impact, advocating for solutions and supporting affected families.
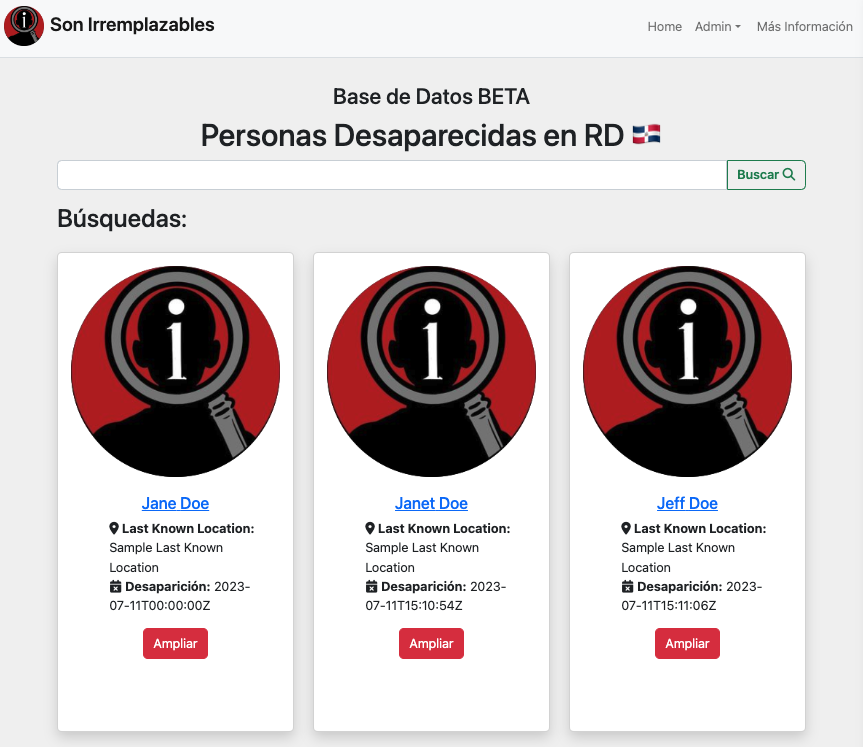
Son Irremplazables Missing Persons Database BETA
I developed a website to create a comprehensive missing persons database for the Dominican Republic. Using technologies like React, AWS S3, PostgreSQL, Heroku, Django, and Redux, this beta version aims to aid in searches and reunifications.
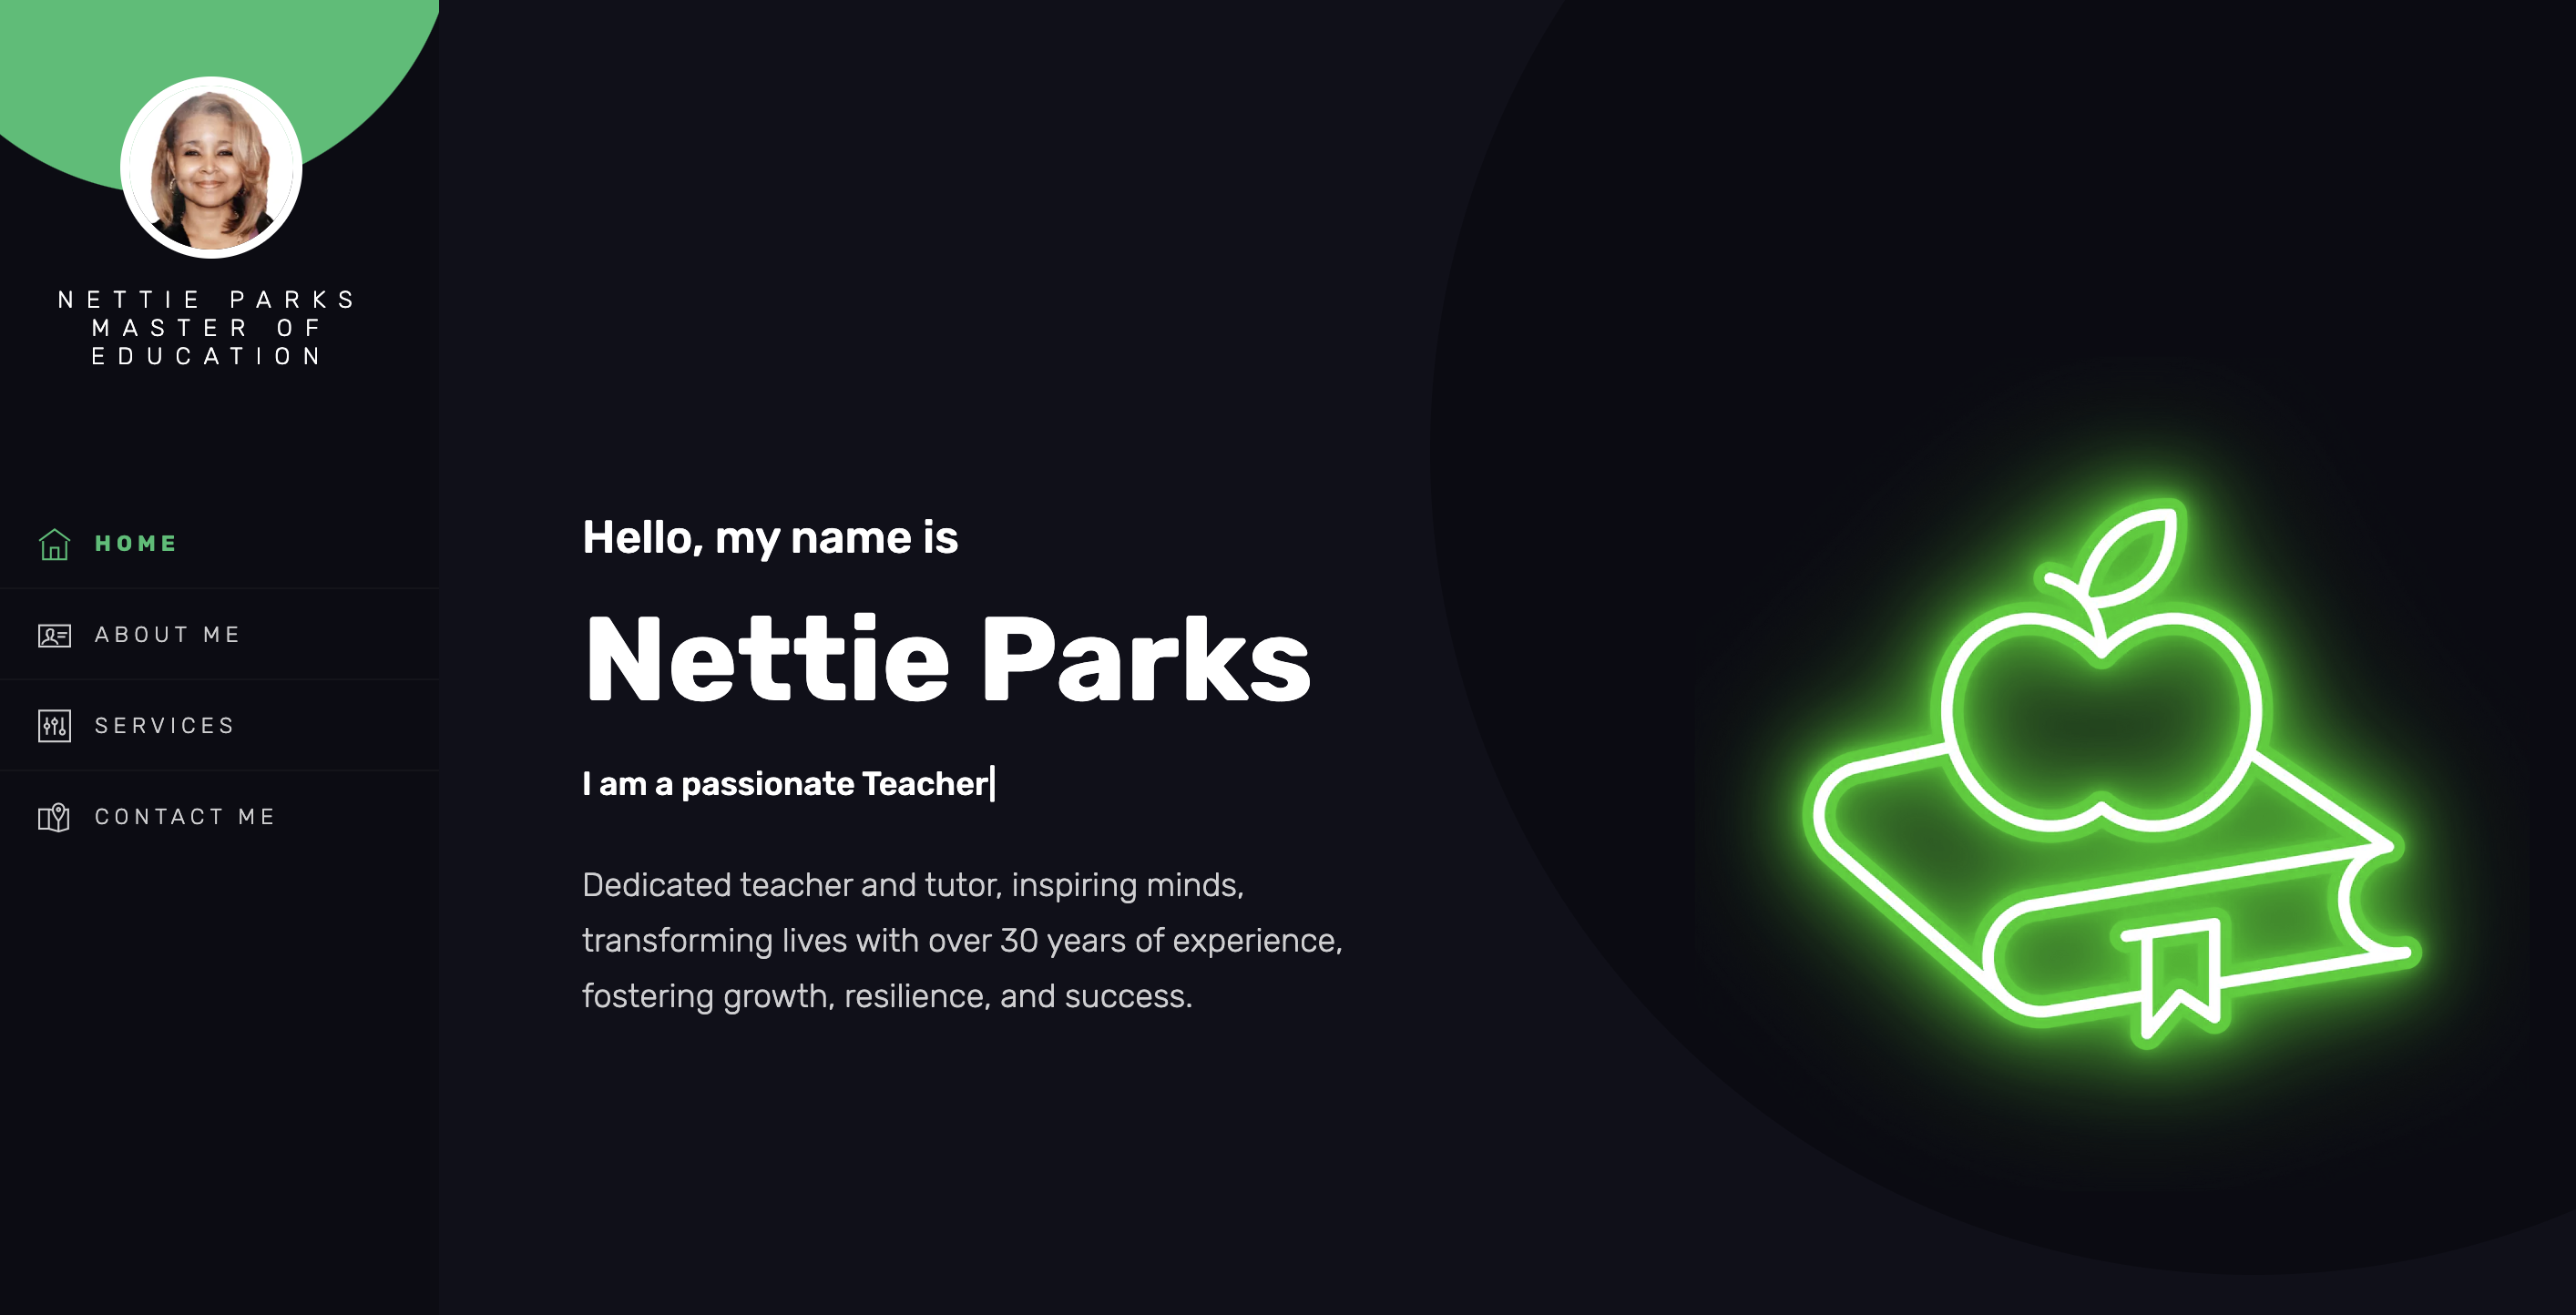
Parks Place Tutoring
I developed a website for a tutoring business to showcase the tutor's expertise and credentials. It features a user-friendly interface and a focus on student testimonials, highlighting the tutor's proficiency and commitment to academic excellence.

The Fund Design Challenge Portal
I developed a web-based tracking system to monitor participant progression through our pitch competition, eliminating the need for a third-party vendor and saving $8,000 in annual costs. The platform tracked real-time signup metrics, completion rates, and participant advancement through multiple competition stages, providing immediate visibility into program performance for grant reporting and strategic decision-making.
Data
Featured Visualizations, Dashboards, Reports

CPS Public School Data Review
I built an interactive Tableau dashboard that visualized Illinois State Board of Education (ISBE) data to analyze relationships between school climate indicators (including parent-teacher partnerships, safety ratings, and student voice) and academic performance in math and reading across Chicago Public Schools.

CPS Live Search
I built a Python-based data pipeline that integrated the CPS API with web scraping (Selenium) to pull school performance metrics from UChicago, CPS, and municipal websites into a single automated workflow. This system generated 125+ standardized school profiles for elected officials, replacing manual data collection and saving 30+ hours of work.

CPS IAR Growth by Network
I created an interactive dashboard that analyzed Illinois Assessment of Readiness (IAR) growth patterns across Chicago Public Schools, focusing on year-over-year improvements in math and reading scores, graduation rates, and chronic absenteeism. By visualizing which school leaders made the biggest strides, the dashboard made it easy to identify principals who could share successful strategies with peers. This data-driven approach helped our team connect high-performing leaders with schools seeking to improve outcomes.

View PDF
Using the automated data pipeline I built, I generated comprehensive school profile reports like this one that consolidated demographics, academic performance trends, leadership information, and 5Essentials ratings into a single-page reference document for elected school board members.

View Report
I contributed to the Fund's 2024-25 program summary to showcase programmatic impact and reach. The report synthesized participant demographics, completion rates, and outcome metrics from leadership cohorts, pitch competitions, and school partnerships into a public-facing report. This summary supported grant reporting requirements and informed strategic planning for the following year.